Plotting#
You can plot datasets using
xarray.DataArray.epoch.plot.
This is a custom sdf_xarray plotting routine that builds on top of
xarray.DataArray.plot, so you keep the familiar xarray plotting
behaviour while using sdf_xarray conveniences (see
here for details).
Under the hood, plotting is still handled by matplotlib, which means you
can use the full matplotlib API to customise your figure.
Dimensions |
Base plotting function |
Notes |
|---|---|---|
1 |
||
2 |
||
3 |
Custom functionality built for |
|
>3 |
Not fully implemented |
Line plots#
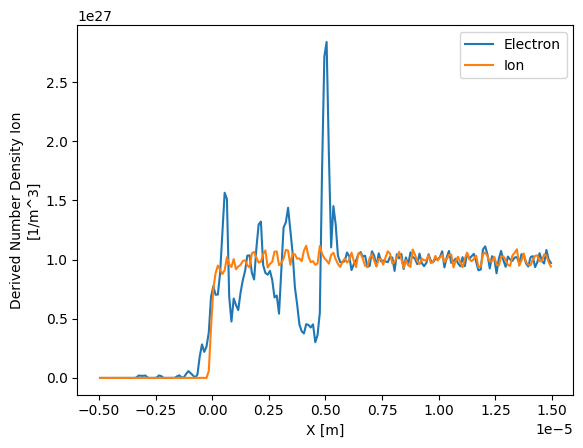
One dimensional data will be plotted as a line. Multiple lines can be easily plotted at the same time.
import sdf_xarray as sdfxr
import matplotlib.pyplot as plt
ds = sdfxr.open_dataset("tutorial_dataset_1d/0010.sdf")
da_1 = ds["Derived_Number_Density_Electron"]
da_2 = ds["Derived_Number_Density_Ion"]
da_1.epoch.plot(label = "Electron")
da_2.epoch.plot(label = "Ion")
plt.legend()
plt.show()
Mesh plots#
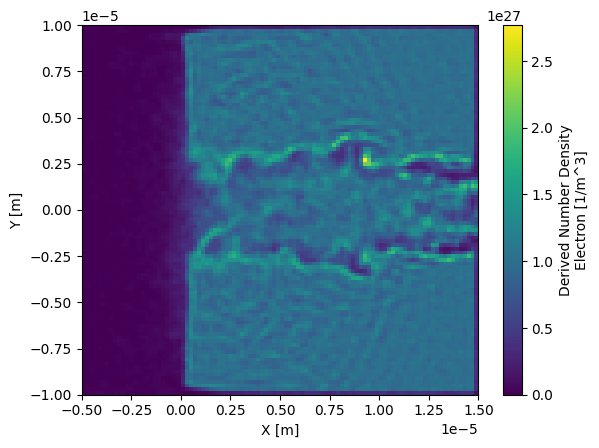
Two dimensional data will be plotted as a mesh.
ds = sdfxr.open_dataset("tutorial_dataset_2d/0010.sdf")
da = ds["Derived_Number_Density_Electron"]
da.epoch.plot()
plt.show()
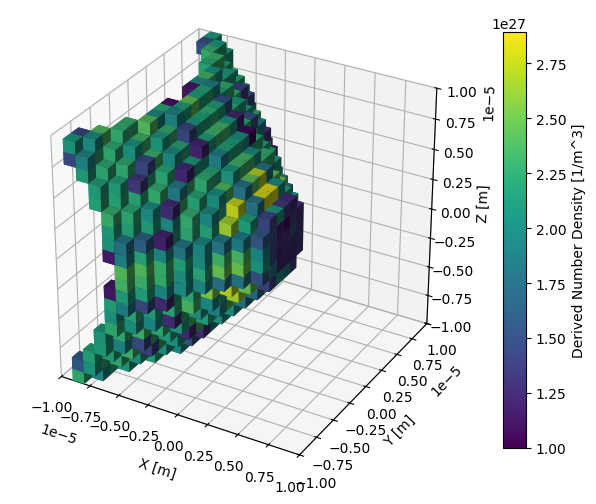
Voxel plots#
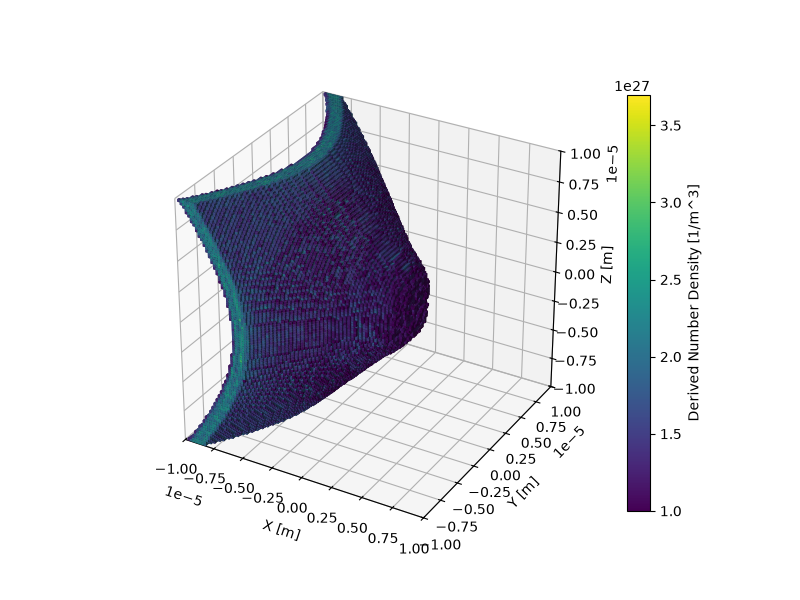
Three dimensional data will be plotted using voxels. This behaviour is not native
to xarray, it has been custom built specifically for this package.
ds = sdfxr.open_dataset("tutorial_dataset_3d/0000.sdf")
da = ds["Derived_Number_Density"]
da.epoch.plot(vmin = 1e27)
plt.show()
Warning
Voxel plots can be extremely computationally expensive and may take longer than expected to plot.
Because voxel plots are very expensive, even with relatively small data arrays,
plotting can be sped up by using xarray.DataArray.epoch.resize,
which uses interpolation to reduce the resolution.
ds = sdfxr.open_dataset("tutorial_dataset_3d/0005.sdf")
da = ds["Derived_Number_Density"]
da_resized = da.epoch.resize((20, 20, 20))
da_resized.epoch.plot(vmin = 1e27)
plt.show()
/home/docs/checkouts/readthedocs.org/user_builds/sdf-xarray/checkouts/v0.9.0/src/sdf_xarray/dataarray_accessor.py:87: UserWarning: Voxel plots can be extremely computationally expensive and may take longer than expected to plot.
  return voxel_plot(self._obj, *args, **kwargs)
Histograms#
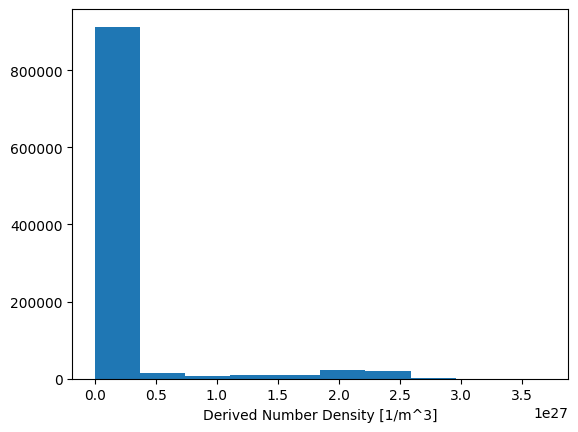
When the data array has four or more dimensions (or is specified by the user), it will be plotted as a histogram.
ds = sdfxr.open_dataset("tutorial_dataset_3d/0005.sdf")
da = ds["Derived_Number_Density"]

da.epoch.plot(hist = True)
plt.show()